You asked for data and methods. I didn’t post or make this. I just gave you the sources that were already available to you. If you want to check the sources, go right on ahead. But since you can’t seem to find things on mobile, here’s an excerpt from the sites section of population data.
Our team, therefore, builds and maintains a long-run dataset on population by country, region, and for the world, based on three key sources:
10,000 BCE to 1799: HYDE version 3.2.
1800 to 1949: Gapminder’s Population version 7
1950 onwards: UN World Population Prospects (2022)
For former countries: Gapminder’s Systema Globalis
The scripts that produce this long-run dataset can be accessed in our GitHub repository.
In all sources we rely on, historical population estimates are based on today’s geographical borders.
We provide a full citation for each source below. If you cite population data for a specific period, please cite the source. For example, for the period 1950 onwards, please cite the UN World Population Prospects. You can add “via Our World in Data” if you downloaded the data from us.
You can find the complete list of the sources used for each country and year here.
And a specific citation from that same site for the prehistoric data…
Full citation: Klein Goldewijk, K., A. Beusen, J.Doelman and E. Stehfest (2017), Anthropogenic land use estimates for the Holocene; HYDE 3.2, Earth System Science Data, 9, 927-953.
The HYDE estimates go up to 2020, but they are only available once per decade for the period 1800–2020. Therefore, from 1800 onwards, when data is available from both HYDE and Gapminder, we favor the Gapminder dataset, as it provides annual estimates
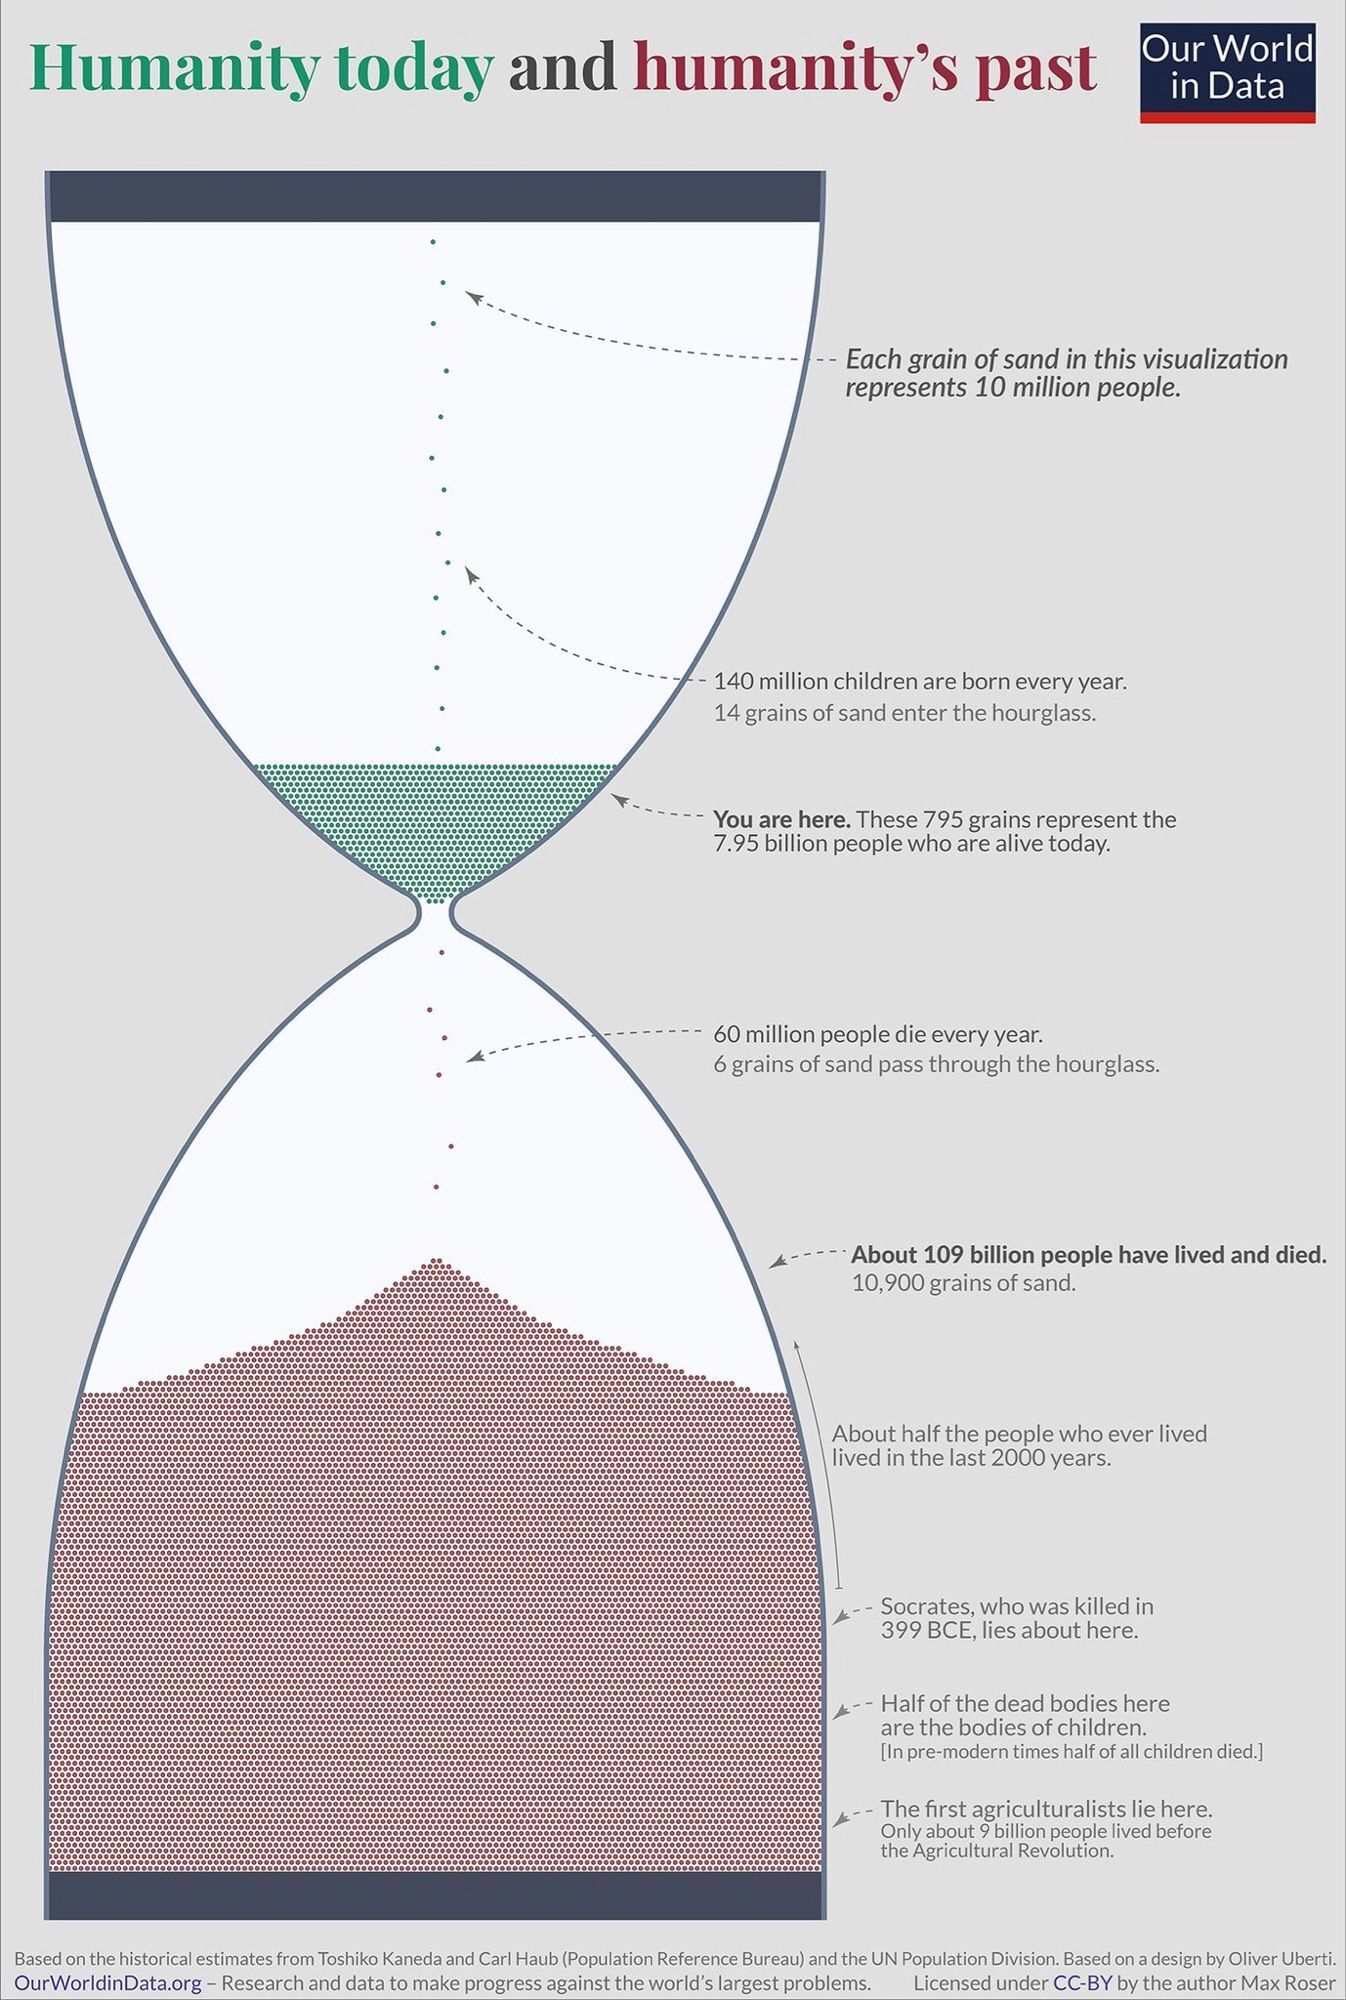
The infographic is counting humans back to 10,000 years ago for the total dead.
But elsewhere in this thread, people are saying bipedal apes with human sized brains have been around anywhere from 50k to 5m years.
So if we’re willing to count our slightly different cousins, whom we could probably relate to if we met them, the column of the dead in the picture would be much deeper.
That makes me think being skeptical was a good idea here. 10 kya cutoff is an interesting and significant piece of this graphic.
All of evolution is a sliding scale. There is no strict delineation.
I never claimed this was a good piece or true or perfect. That “scientist” was being over the top and purposefully myopic with sources provided, they still only desired to shit on someone else’s work and then state I didn’t read the methods.
There are no real hard facts for that era of time population wise. It’s all estimation based on something. It just depends on how you draw the lines in the sand.
There are no hotdogs, there are no sandwiches. It’s all a construct of human applied labels.


You asked for data and methods. I didn’t post or make this. I just gave you the sources that were already available to you. If you want to check the sources, go right on ahead. But since you can’t seem to find things on mobile, here’s an excerpt from the sites section of population data.
And a specific citation from that same site for the prehistoric data…
-Posted via Sync for Lemmy.
That’s one of your key answers there:
The infographic is counting humans back to 10,000 years ago for the total dead.
But elsewhere in this thread, people are saying bipedal apes with human sized brains have been around anywhere from 50k to 5m years.
So if we’re willing to count our slightly different cousins, whom we could probably relate to if we met them, the column of the dead in the picture would be much deeper.
That makes me think being skeptical was a good idea here. 10 kya cutoff is an interesting and significant piece of this graphic.
All of evolution is a sliding scale. There is no strict delineation.
I never claimed this was a good piece or true or perfect. That “scientist” was being over the top and purposefully myopic with sources provided, they still only desired to shit on someone else’s work and then state I didn’t read the methods.
There are no real hard facts for that era of time population wise. It’s all estimation based on something. It just depends on how you draw the lines in the sand.
There are no hotdogs, there are no sandwiches. It’s all a construct of human applied labels.
But I generally agree. 300k years is a long time.