You asked for data and methods. I didn’t post or make this. I just gave you the sources that were already available to you. If you want to check the sources, go right on ahead. But since you can’t seem to find things on mobile, here’s an excerpt from the sites section of population data.
Our team, therefore, builds and maintains a long-run dataset on population by country, region, and for the world, based on three key sources:
10,000 BCE to 1799: HYDE version 3.2.
1800 to 1949: Gapminder’s Population version 7
1950 onwards: UN World Population Prospects (2022)
For former countries: Gapminder’s Systema Globalis
The scripts that produce this long-run dataset can be accessed in our GitHub repository.
In all sources we rely on, historical population estimates are based on today’s geographical borders.
We provide a full citation for each source below. If you cite population data for a specific period, please cite the source. For example, for the period 1950 onwards, please cite the UN World Population Prospects. You can add “via Our World in Data” if you downloaded the data from us.
You can find the complete list of the sources used for each country and year here.
And a specific citation from that same site for the prehistoric data…
Full citation: Klein Goldewijk, K., A. Beusen, J.Doelman and E. Stehfest (2017), Anthropogenic land use estimates for the Holocene; HYDE 3.2, Earth System Science Data, 9, 927-953.
The HYDE estimates go up to 2020, but they are only available once per decade for the period 1800–2020. Therefore, from 1800 onwards, when data is available from both HYDE and Gapminder, we favor the Gapminder dataset, as it provides annual estimates
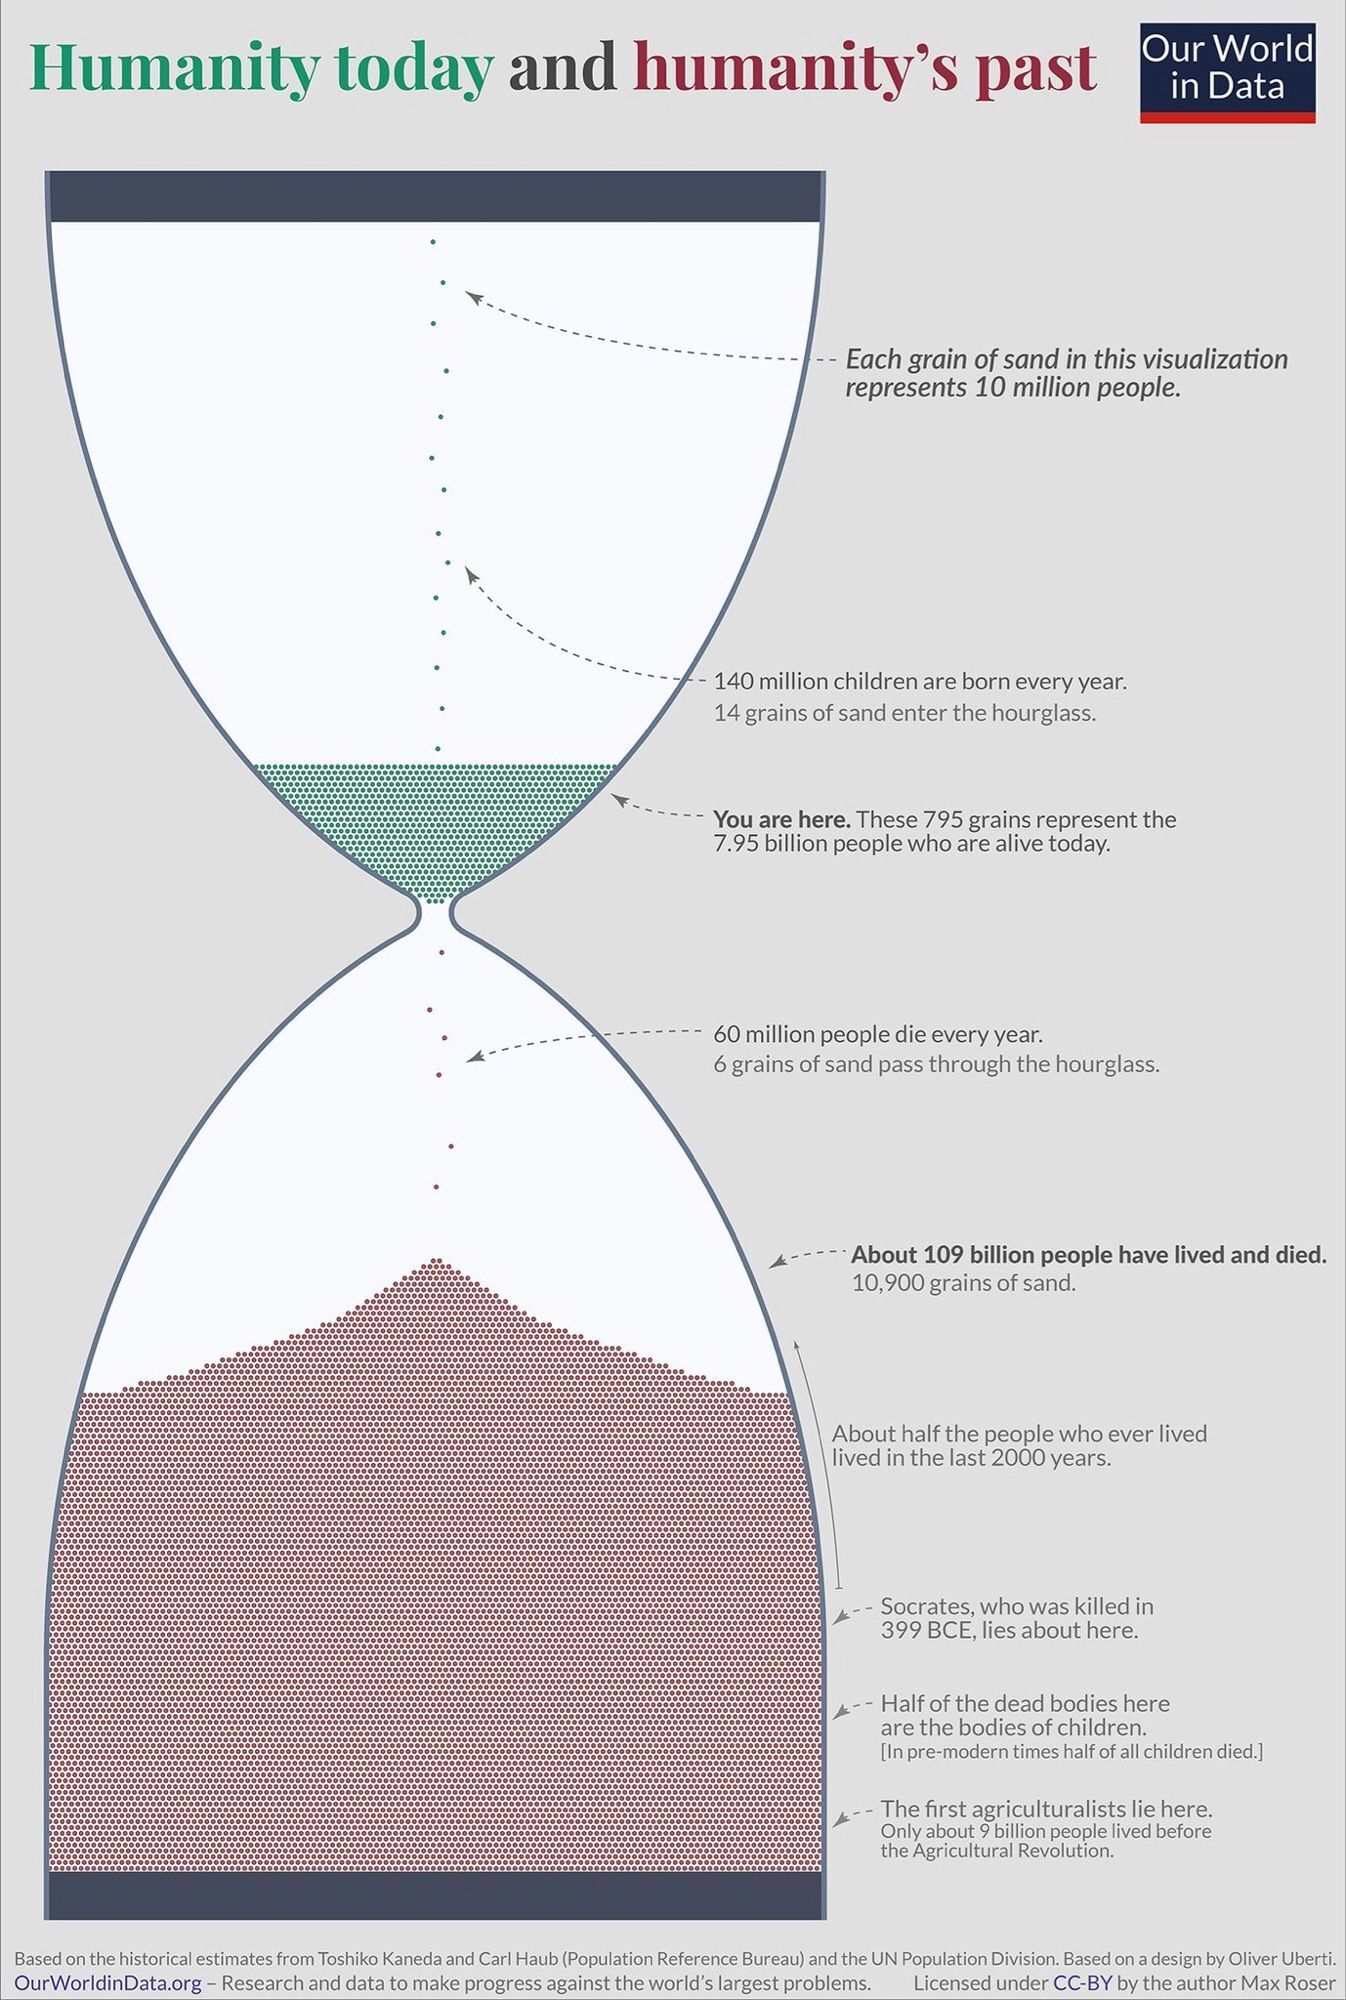
The infographic is counting humans back to 10,000 years ago for the total dead.
But elsewhere in this thread, people are saying bipedal apes with human sized brains have been around anywhere from 50k to 5m years.
So if we’re willing to count our slightly different cousins, whom we could probably relate to if we met them, the column of the dead in the picture would be much deeper.
That makes me think being skeptical was a good idea here. 10 kya cutoff is an interesting and significant piece of this graphic.
All of evolution is a sliding scale. There is no strict delineation.
I never claimed this was a good piece or true or perfect. That “scientist” was being over the top and purposefully myopic with sources provided, they still only desired to shit on someone else’s work and then state I didn’t read the methods.
There are no real hard facts for that era of time population wise. It’s all estimation based on something. It just depends on how you draw the lines in the sand.
There are no hotdogs, there are no sandwiches. It’s all a construct of human applied labels.
I’ve seen the same kind of visualization made from different sources before showing the same point. There is really nothing shocking or unbelievable in the picture?
If you have a better way of estimating the figure, I’m sure they would be all ears.
I do remember reading school books and science articles 30-40 years ago and the estimates then were different, but that’s just how science works.
Again it’s fine to be sceptical, but unless you can provide an alternative figure with better documentation, I really don’t understand why you’re encouraging people to be sceptical.
It’s almost as if you seem to have different motive, so I have decided to doubt your scepticism.
this seems to be where the image originally came from. the author explains the challenges with making speculations about historical populations in that post. the demographers, toshiko kaneda and carl haub, estimated 117 billion people have lived over the last 200,000 years. here’s the explanation given on the original post:
The majority of them lived very short lives: about one in two children died in the past. When conditions are so very poor and children die so quickly then the birth rate has to be extremely high to keep humanity alive; Kaneda and Haub assume a birth rate of 80 births per 1000 people per year for most of humanity’s history (up to the year 1 CE). That is a rate of births that is about 8-times higher than in a typical high-income country and more than twice as high as in the poorest countries today (see the map). The past was a very different place.
i think this is fairly reasonable, but original source is necessary. i think this is a more original source, and kaneda and haub are listed as the authors. their methodology seems to rely a lot on guessing, which makes sense. the 117 billion is probably not entirely accurate, but i’d say it’s a good attempt at estimating given what we know. there might be a more detailed paper somewhere but i didn’t really look too hard
edit: also lot of hostility from other people here… lemmy gone downhill. i think there’s nothing wrong with being skeptical of data or science, even if it’s coming from qualified experts. unless there’s a detailed paper that explains EVERY step of their process, you can’t be entirely sure where their numbers are coming from. that said, i agree with those other guys that there’s not a lot of room to be skeptical in this particular case, since the authors explicitly say it’s a rough estimate. based on what we know, it’s as accurate as we can get. but still, nothing wrong with asking for sources!
I haven’t read the methods. But at the very outset, I question the modeling of birth and death rates from ages before the advent of agriculture. This, immediately, gives me pause.
yes, you’re definitely right. the accuracy is dubious no matter what. in the author’s words, their approach is “semi-scientific” and “guesstimating”. not once do they say their results are definitive. but if it’s the best qualified demographers can do with what we know, then there’s not much else to it


Easy to miss on mobile. And I assume you’ve read this and examined the primary data? And you understand the methods? Because science is not trivial.
You asked for data and methods. I didn’t post or make this. I just gave you the sources that were already available to you. If you want to check the sources, go right on ahead. But since you can’t seem to find things on mobile, here’s an excerpt from the sites section of population data.
And a specific citation from that same site for the prehistoric data…
-Posted via Sync for Lemmy.
That’s one of your key answers there:
The infographic is counting humans back to 10,000 years ago for the total dead.
But elsewhere in this thread, people are saying bipedal apes with human sized brains have been around anywhere from 50k to 5m years.
So if we’re willing to count our slightly different cousins, whom we could probably relate to if we met them, the column of the dead in the picture would be much deeper.
That makes me think being skeptical was a good idea here. 10 kya cutoff is an interesting and significant piece of this graphic.
All of evolution is a sliding scale. There is no strict delineation.
I never claimed this was a good piece or true or perfect. That “scientist” was being over the top and purposefully myopic with sources provided, they still only desired to shit on someone else’s work and then state I didn’t read the methods.
There are no real hard facts for that era of time population wise. It’s all estimation based on something. It just depends on how you draw the lines in the sand.
There are no hotdogs, there are no sandwiches. It’s all a construct of human applied labels.
But I generally agree. 300k years is a long time.
I’ve seen the same kind of visualization made from different sources before showing the same point. There is really nothing shocking or unbelievable in the picture?
It’s fine to be sceptical because it is an estimate. However it is a qualified estimate. Read more from the source: https://www.prb.org/articles/how-many-people-have-ever-lived-on-earth/
If you have a better way of estimating the figure, I’m sure they would be all ears.
I do remember reading school books and science articles 30-40 years ago and the estimates then were different, but that’s just how science works.
Again it’s fine to be sceptical, but unless you can provide an alternative figure with better documentation, I really don’t understand why you’re encouraging people to be sceptical.
It’s almost as if you seem to have different motive, so I have decided to doubt your scepticism.
Because I’m a scientist and I know from being in the field that a lot of studies are wrong.
Come on then, at the very fucking least just state what you think is wrong with the post.
Source? 🤔
Is that a source? No
Go ask the person who said that for their source, and ask yourself why you didn’t start with them in the first place.
I did?
Fucking retracted papers? Models that are irreproducible? Have you ever participated in peer review?
Don’t take any guff from these swine, Cabron
not op but i think your skepticism is justified
this seems to be where the image originally came from. the author explains the challenges with making speculations about historical populations in that post. the demographers, toshiko kaneda and carl haub, estimated 117 billion people have lived over the last 200,000 years. here’s the explanation given on the original post:
i think this is fairly reasonable, but original source is necessary. i think this is a more original source, and kaneda and haub are listed as the authors. their methodology seems to rely a lot on guessing, which makes sense. the 117 billion is probably not entirely accurate, but i’d say it’s a good attempt at estimating given what we know. there might be a more detailed paper somewhere but i didn’t really look too hard
edit: also lot of hostility from other people here… lemmy gone downhill. i think there’s nothing wrong with being skeptical of data or science, even if it’s coming from qualified experts. unless there’s a detailed paper that explains EVERY step of their process, you can’t be entirely sure where their numbers are coming from. that said, i agree with those other guys that there’s not a lot of room to be skeptical in this particular case, since the authors explicitly say it’s a rough estimate. based on what we know, it’s as accurate as we can get. but still, nothing wrong with asking for sources!
I haven’t read the methods. But at the very outset, I question the modeling of birth and death rates from ages before the advent of agriculture. This, immediately, gives me pause.
yes, you’re definitely right. the accuracy is dubious no matter what. in the author’s words, their approach is “semi-scientific” and “guesstimating”. not once do they say their results are definitive. but if it’s the best qualified demographers can do with what we know, then there’s not much else to it